Discussion of Beam-forming
Affects of delays on signal
Beam-forming uses the property that when multiple signals are received at one point they add. By changing the delay on each antenna, a signal can be generated that will maximumly combine at the specified point. Without a delay 10 antennas each producing the same signal will produce a signal such as this.
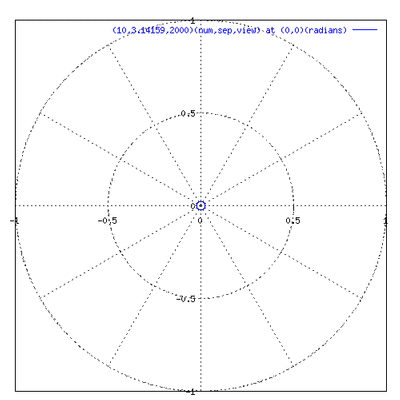
The small blue circle is the radiation pattern. It has a Directivity of just 1.045487. Directivity is calculated by taking the Maximum power and dividing it by the Average power. Setting each antenna to the same delay has no usable signal. However if one takes a specific point and calculates the relative delays to it. And then uses those delays when sending the signal. it produces a much more directional signal.
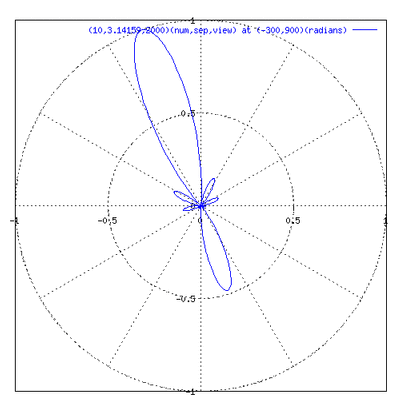
Directivity: 7.486404.
Each antenna had the following delays added to it:
The first value is x position, y position, delay aiming at (-300,900)
      Antenna 0 position 5.083204,0.000000,0.000000
      Antenna 1 position 4.112398,2.987832,3.141340
      Antenna 2 position 1.570796,4.834414,5.704460
      Antenna 3 position -1.570796,4.834414,6.702742
      Antenna 4 position -4.112398,2.987832,5.750020
      Antenna 5 position -5.083204,0.000000,3.214859
      Antenna 6 position -4.112398,-2.987832,0.073276
      Antenna 7 position -1.570796,-4.834414,-2.474696
      Antenna 8 position 1.570796,-4.834414,-3.463372
      Antenna 9 position 4.112398,-2.987832,-2.519862
Affects of number of antennas on signal
The number of antennas use for beam-forming has a great effect on the directivity of the signal. 1 antenna produces an omni-directional signal. 2 however produces a pattern such as this.
(click)
Directivity: 1.688710 Although the directivity is not that high the it is considerable more directive than just one antenna. Notice how the lobe forms to produce a symmetrical waveform. Each lobe balances the other to produce the maximum signal in desired direction.
3 antennas
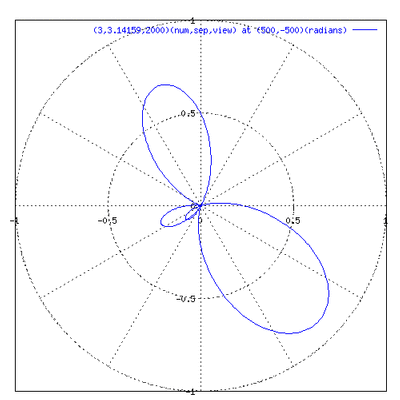 (click)
Directivity: 3.131173
Doing much better However still radiating significant power in unwanted directions.
6 antennas
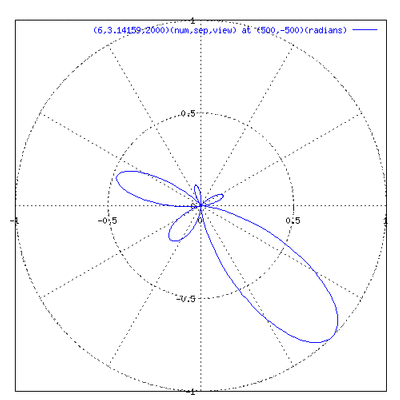 click
click
Directivity: 4.858402
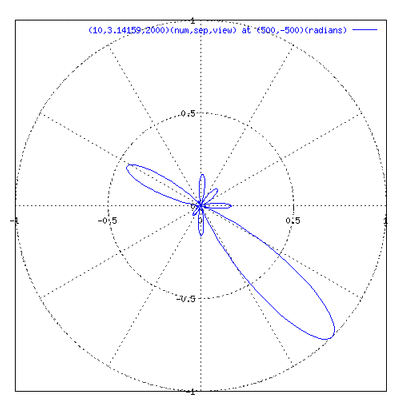
10 antennas
 click
click
Directivity: 7.084568
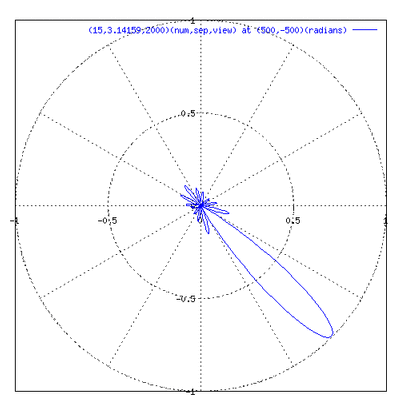
15 antennas
 click
click
Directivity: 11.100104
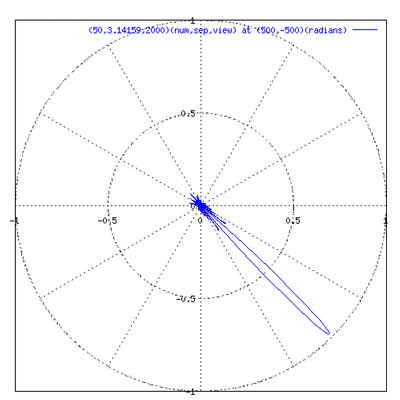
50 antennas
 click
click
Directivity: 29.390900
As one can see when 50 antennas are used nearly all of the energy is going toward the intended point. However with just 10 or 15 antennas a similar result can be observed. Animated gif from 1-50 antennas
Affects of distance between antennas
The distance between each antenna has a great effect on the directivity and predictably of the signal.
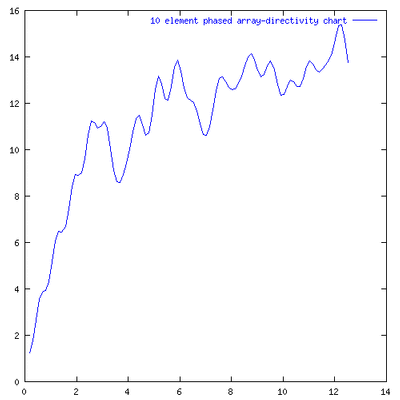
Right around Pi is the first local maximum. However there are other local maximums the farther apart the antennas are.
This is the graph at pi
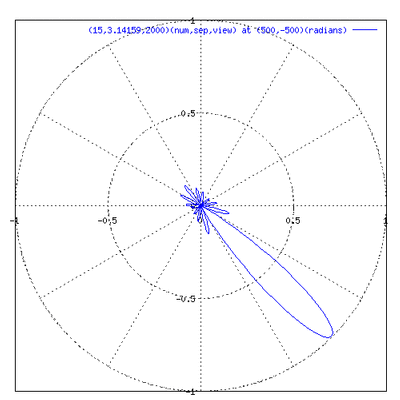 click
click
Directivity: 11.100104
6 radians
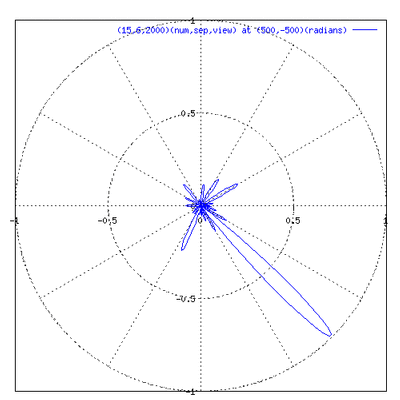 click
click
Directivity: 13.594116
12.1 radians
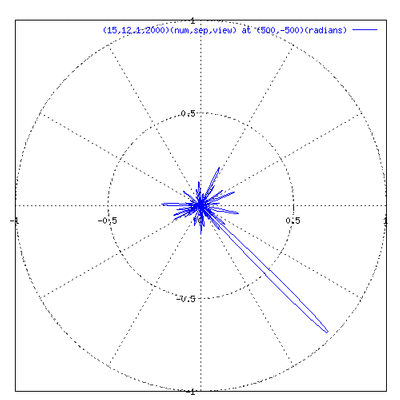 click
click
Directivity: 15.194268
The graph at Pi radians shows a small symmetrical pattern. where as the one at 12.1 has many small lobes coming out in different directions. This can make things difficult when sending out more than one signal. Animated gif from Pi/16 to 16Pi
Affect of distance target is from array
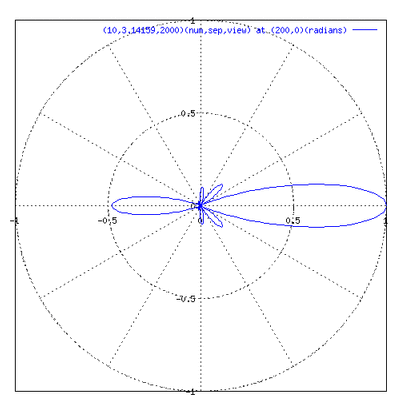
At about 200 radians from the array, the delays are nearly the same as one coming from 2000 radians away.
delays from 200 rads
Antenna 0 position 5.083204,0.000000,0.000000
Antenna 1 position 4.112398,2.987832,-0.993591
Antenna 2 position 1.570796,4.834414,-3.571290
Antenna 3 position -1.570796,4.834414,-6.711965
Antenna 4 position -4.112398,2.987832,-9.217469
Antenna 5 position -5.083204,0.000000,-10.166407
Antenna 6 position -4.112398,-2.987832,-9.217469
Antenna 7 position -1.570796,-4.834414,-6.711965
Antenna 8 position 1.570796,-4.834414,-3.571290
Antenna 9 position 4.112398,-2.987832,-0.993591
delays from 2000 rads
Antenna 0 position 5.083204,0.000000,0.000000
Antenna 1 position 4.112398,2.987832,-0.973042
Antenna 2 position 1.570796,4.834414,-3.518255
Antenna 3 position -1.570796,4.834414,-6.659838
Antenna 4 position -4.112398,2.987832,-9.197829
Antenna 5 position -5.083204,0.000000,-10.166407
Antenna 6 position -4.112398,-2.987832,-9.197829
Antenna 7 position -1.570796,-4.834414,-6.659838
Antenna 8 position 1.570796,-4.834414,-3.518255
Antenna 9 position 4.112398,-2.987832,-0.973042
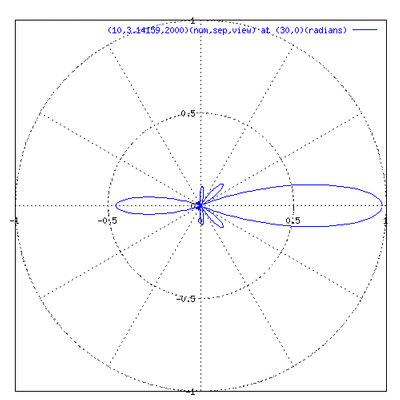
However up close between 30 and 100 radians the delay difference are enough to cause significant changes in the resulting pattern
position is 10 rads away
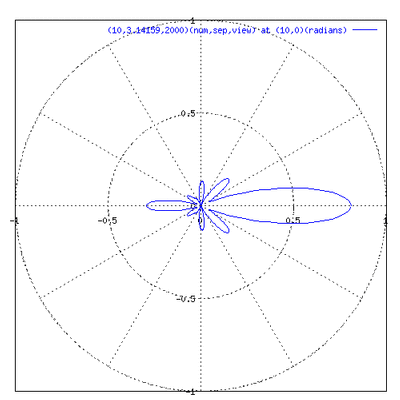 click
click
position is 30 rads away
 click
click
position is 200 rads away
 click
click
This shows that broadcasting at close in points has less of an effect at great distances (the view radius is at 2000 rads).
Matthew Hewitt
Last modified: Wed Dec 8 13:46:47 PST 1999


